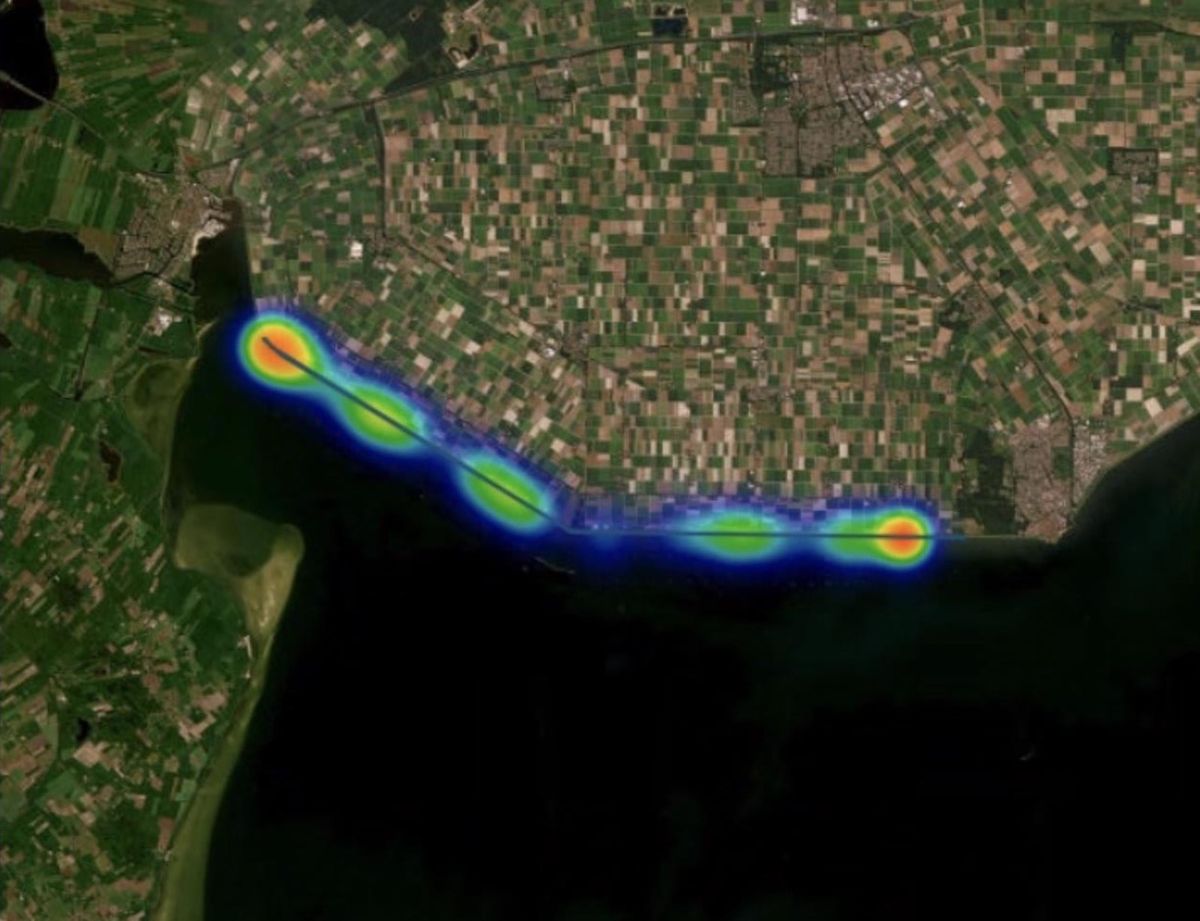
Micro urban heat islands
MUHID
Finds the few small hotspots that overheat whole districts, so one tree or one water basin can cool a neighbourhood.
The challenge
Heat waves are getting longer and hotter, but urban climate analyses are elaborate and expensive. That is why most cities commission them only every five years, and why the results are too coarse to say where exactly a measure should go.
Our approach
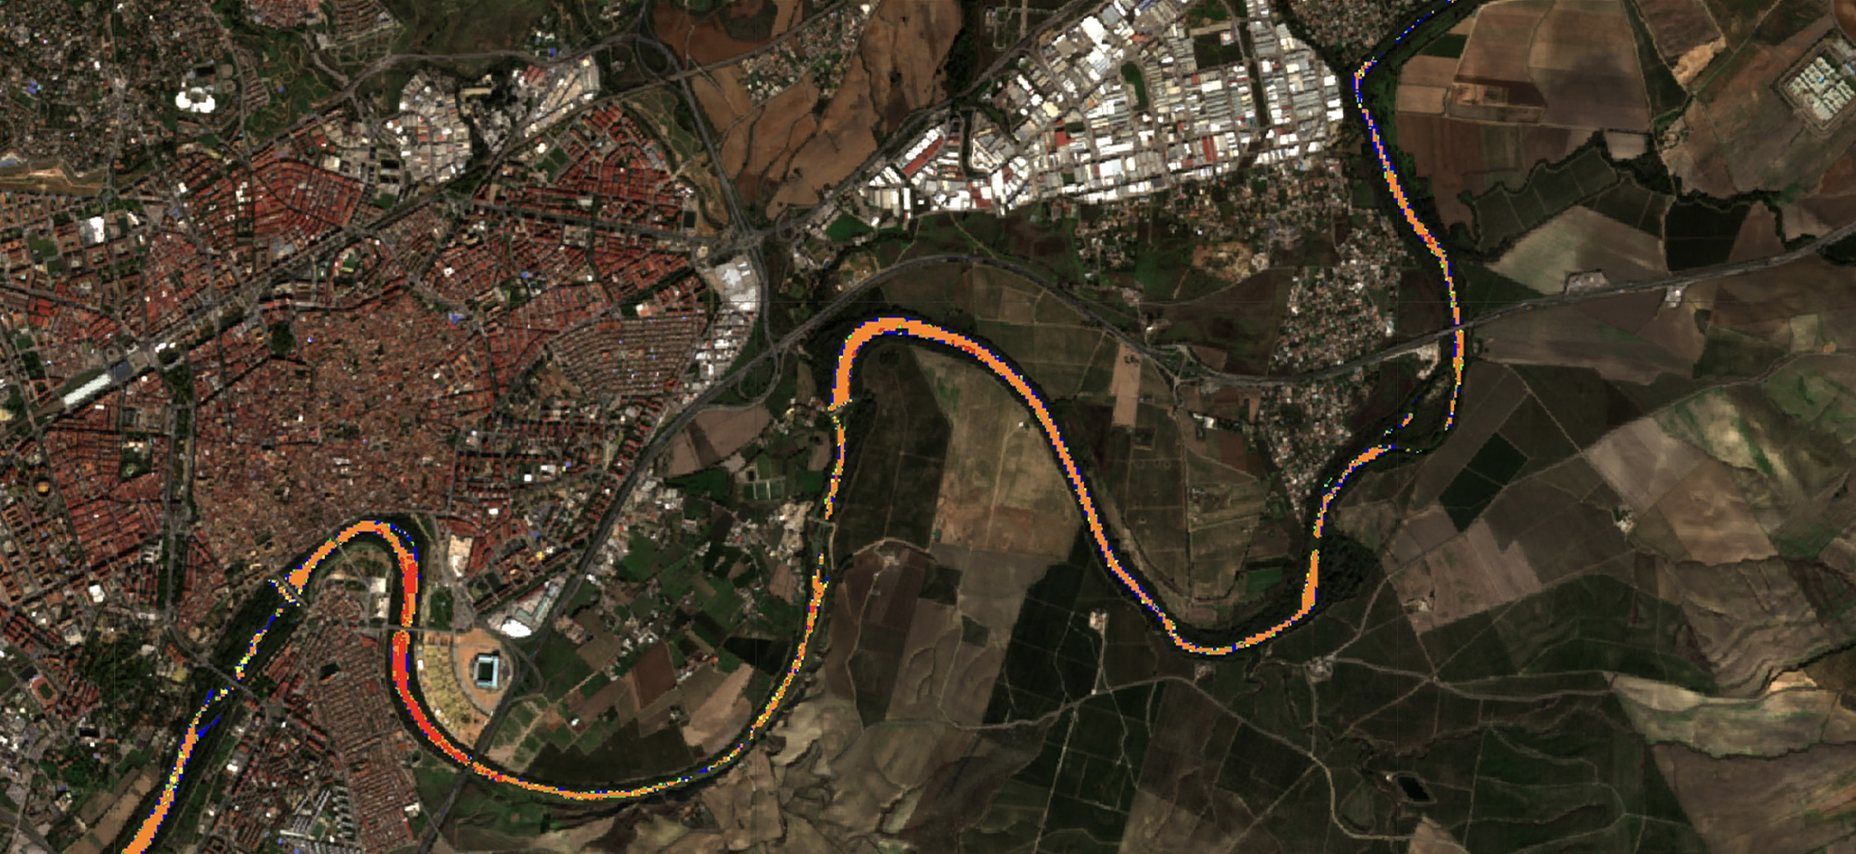
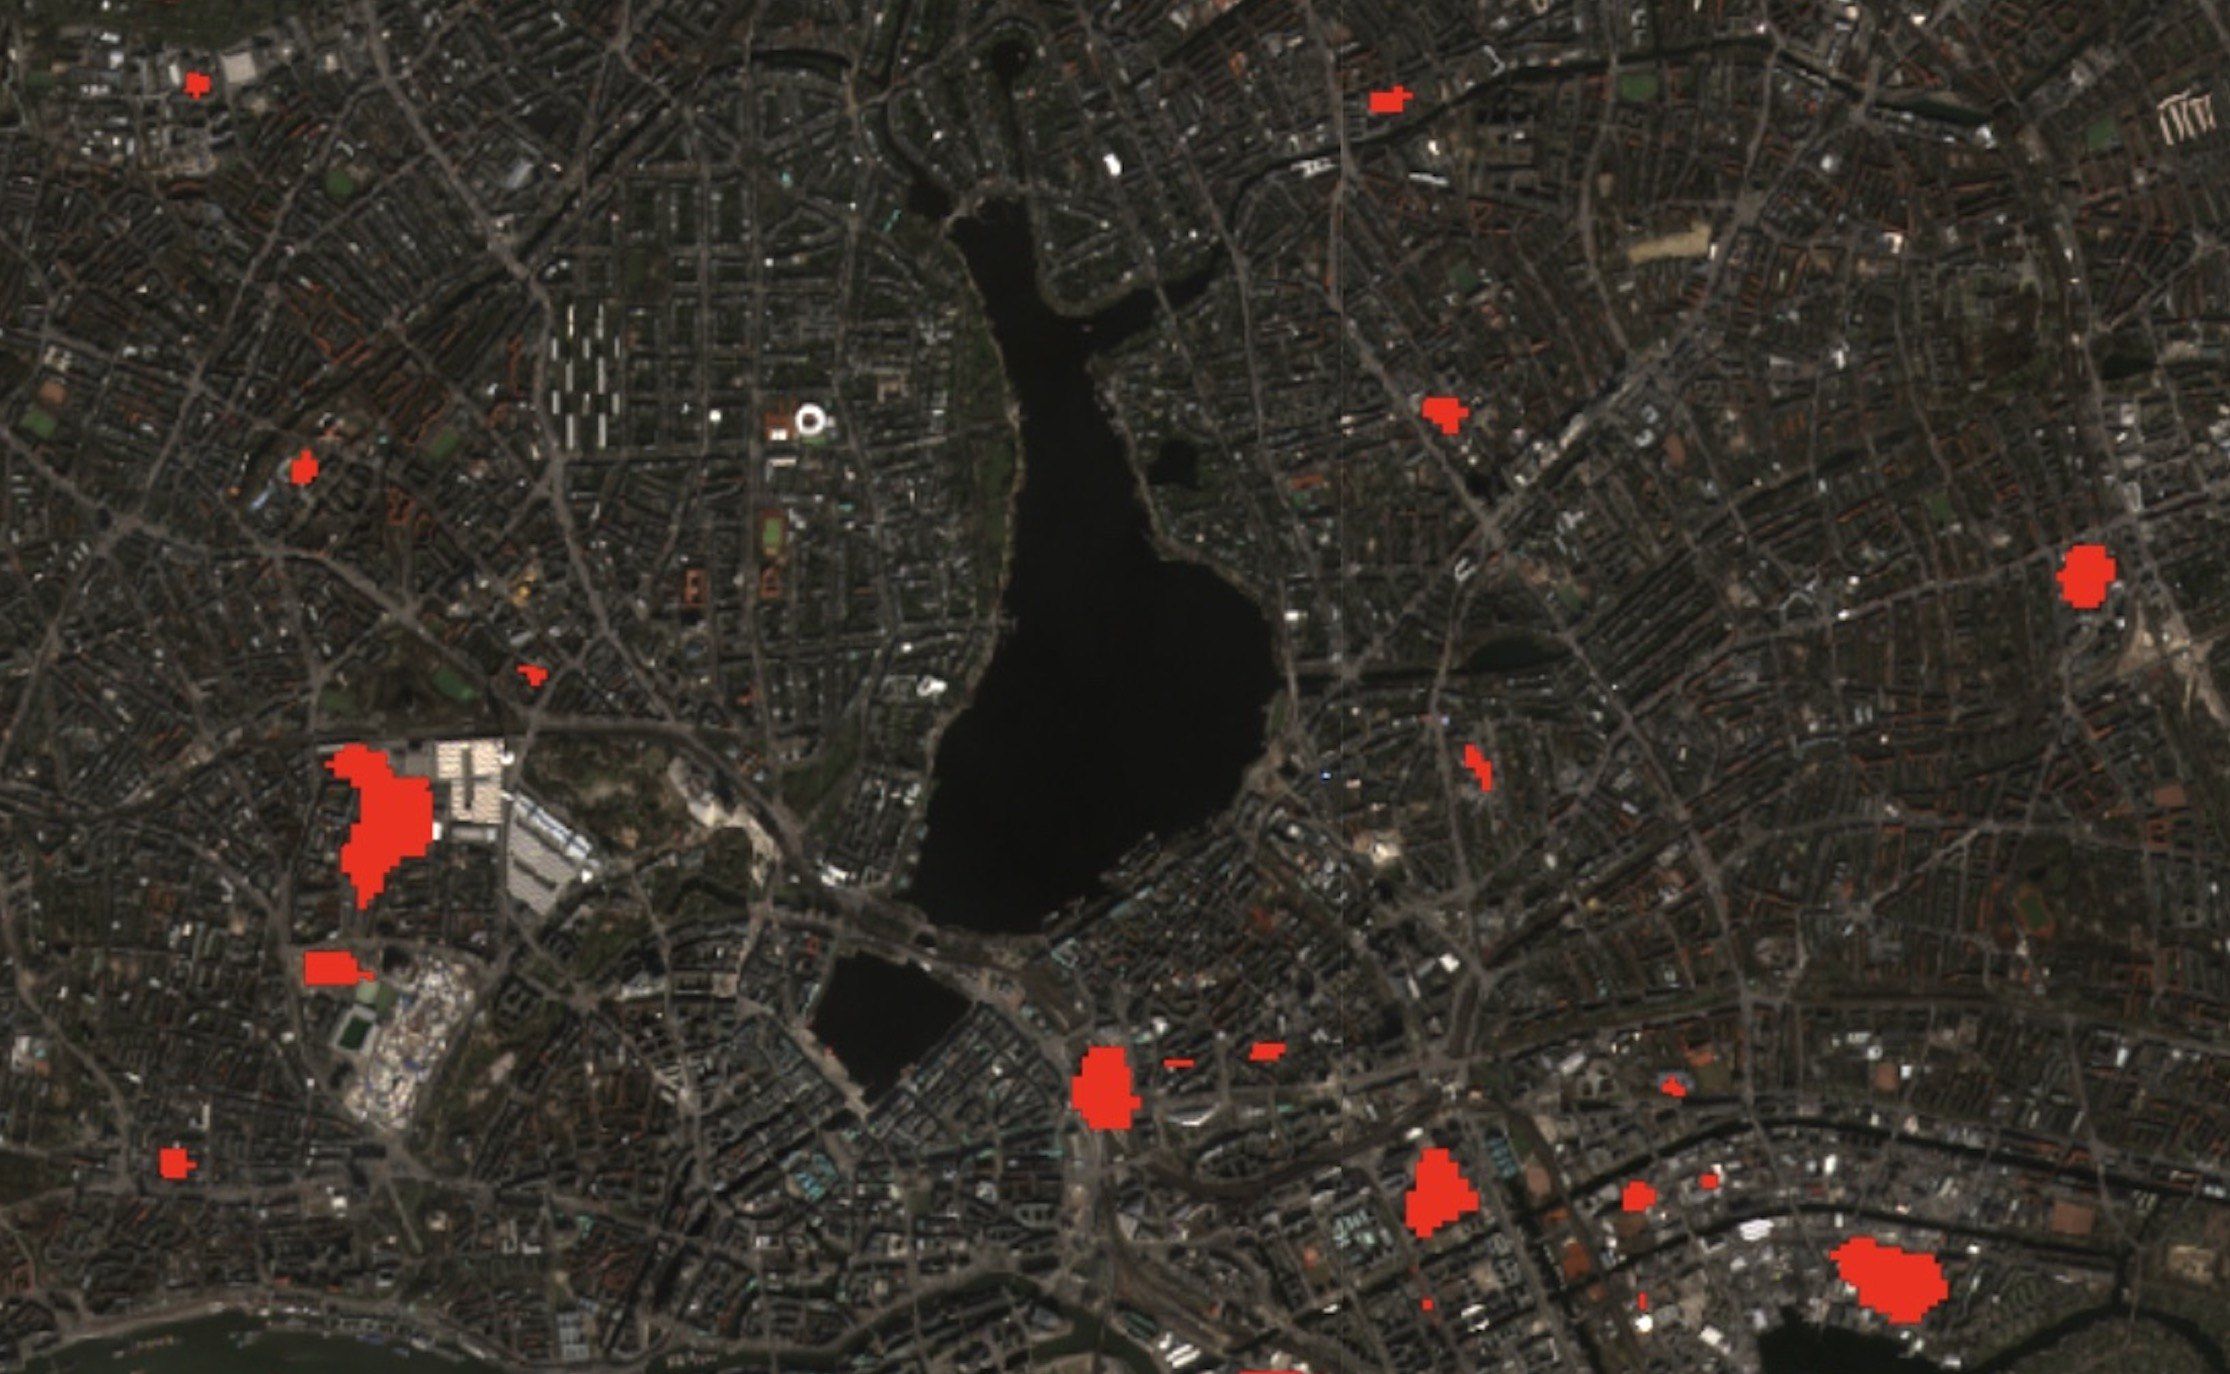
MUHID is affordable, fast and precise. It identifies the hottest places of a city at 10 × 10 metres from satellite data. A micro forest or a small water surface on one of these small hotspots can lower the temperature of the whole district. Minimal intervention, maximum effect.
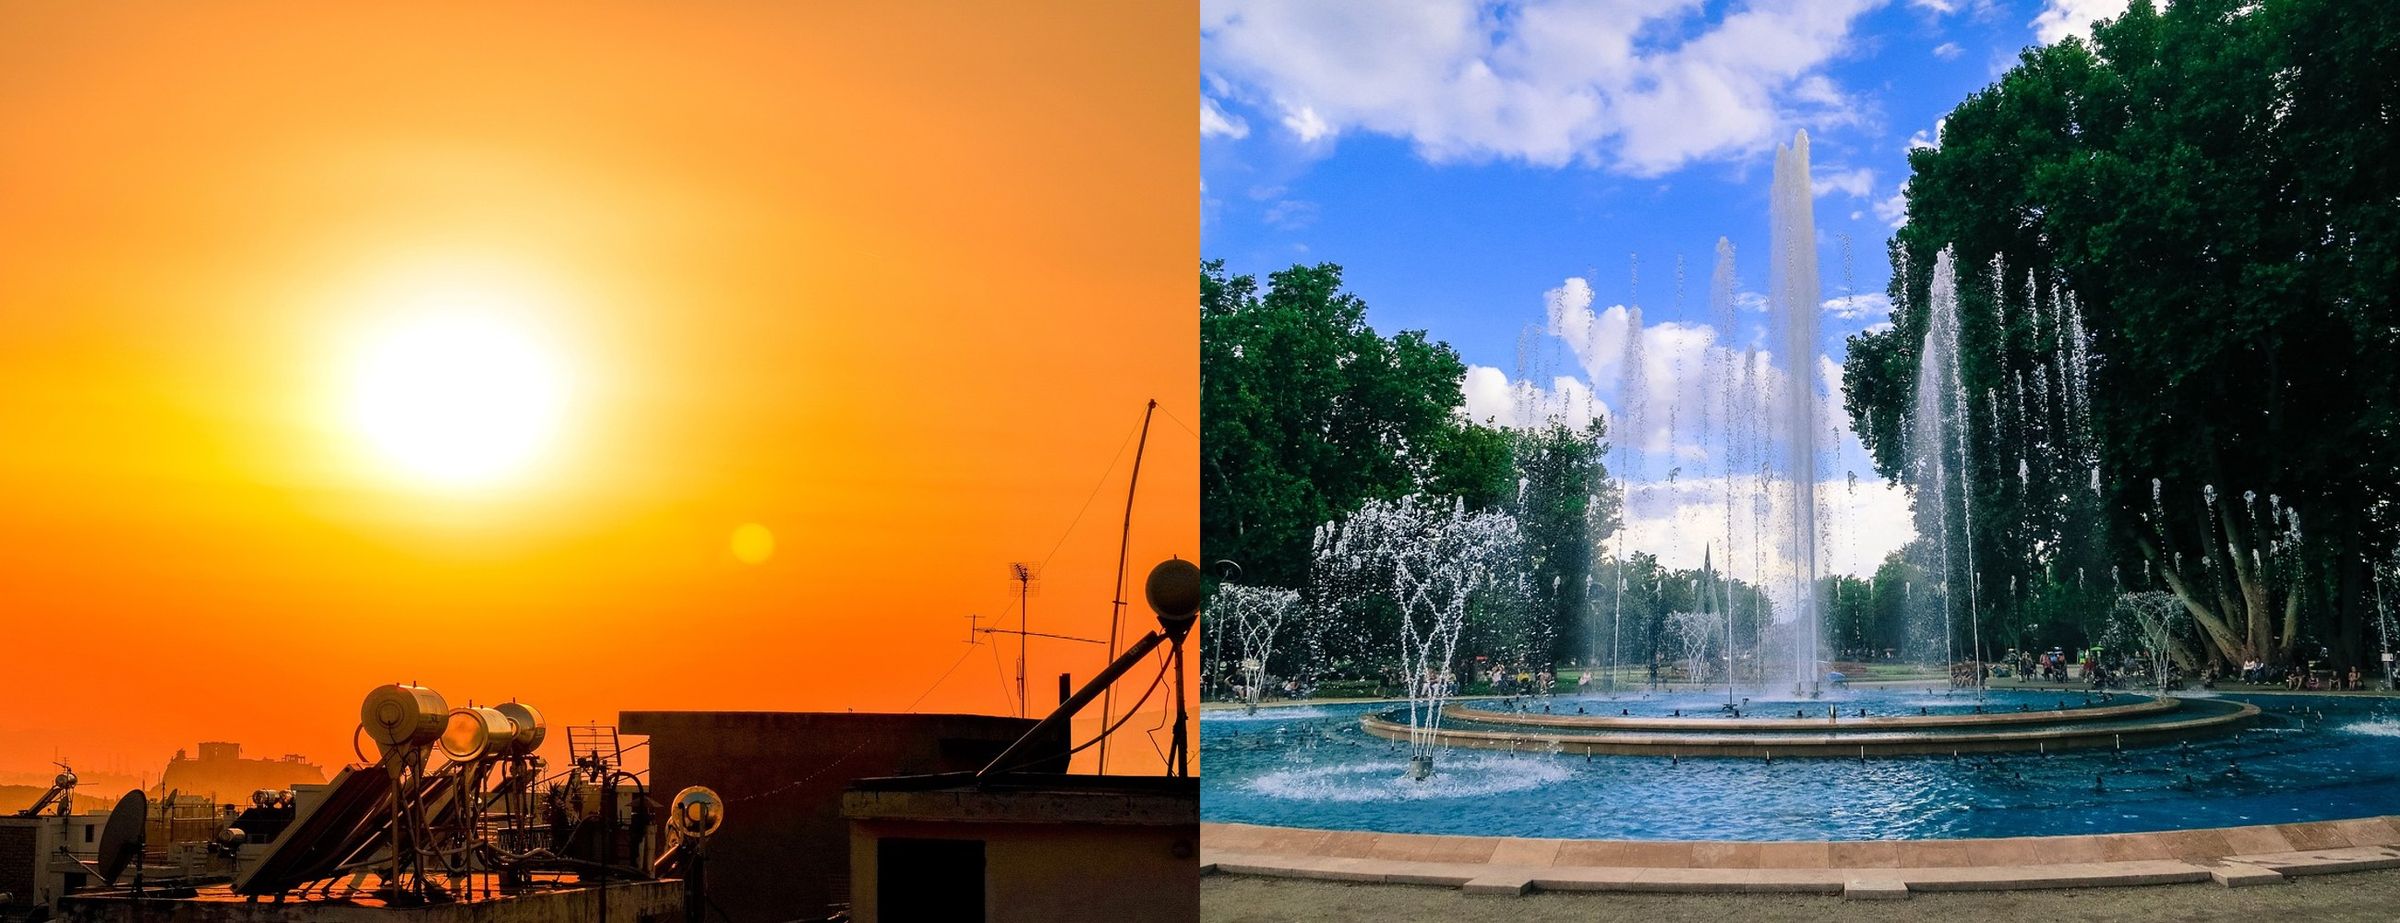
From hotspot to measure.
Three steps from satellite image to cooler district.
Why MUHID.
Usual climate analyses are imprecise, expensive and quickly outdated. MUHID is precise, affordable and available any time, for any city in the world. And it matters most where summers are hottest.
Precise to 10 × 10 metres
Not a district average, but the exact spot. Fine enough that a single tree, a new surface or a small water basin becomes a meaningful measure.
Weekly instead of every five years
Satellites pass every few days. MUHID updates weekly and compares across seasons and years, so measures can be checked instead of assumed.
Measured, not simulated
MUHID uses the surface temperature the satellite actually measured, not a model of buildings and wind flow.
A fraction of the cost
No simulation, no field survey, no sensors. MUHID is simple to use, and it scales to any city, anywhere.
Where MUHID helps
- High-resolution maps of micro urban heat islands
- The coolest places of the city, on request
- Prioritising trees, water and shade where they cool most
- Evidence of whether measures actually work
Who MUHID is for
- Cities and municipalities
- Climate adaptation managers
- Urban and landscape planners
- Housing companies and campus operators
Nominated for the KOINNO Award 2025. Data: Sentinel-2, Landsat 8.
Interested in MUHID?
Tell us which city you want to cool down, and we’ll show you where to start.
Daniel Lanz