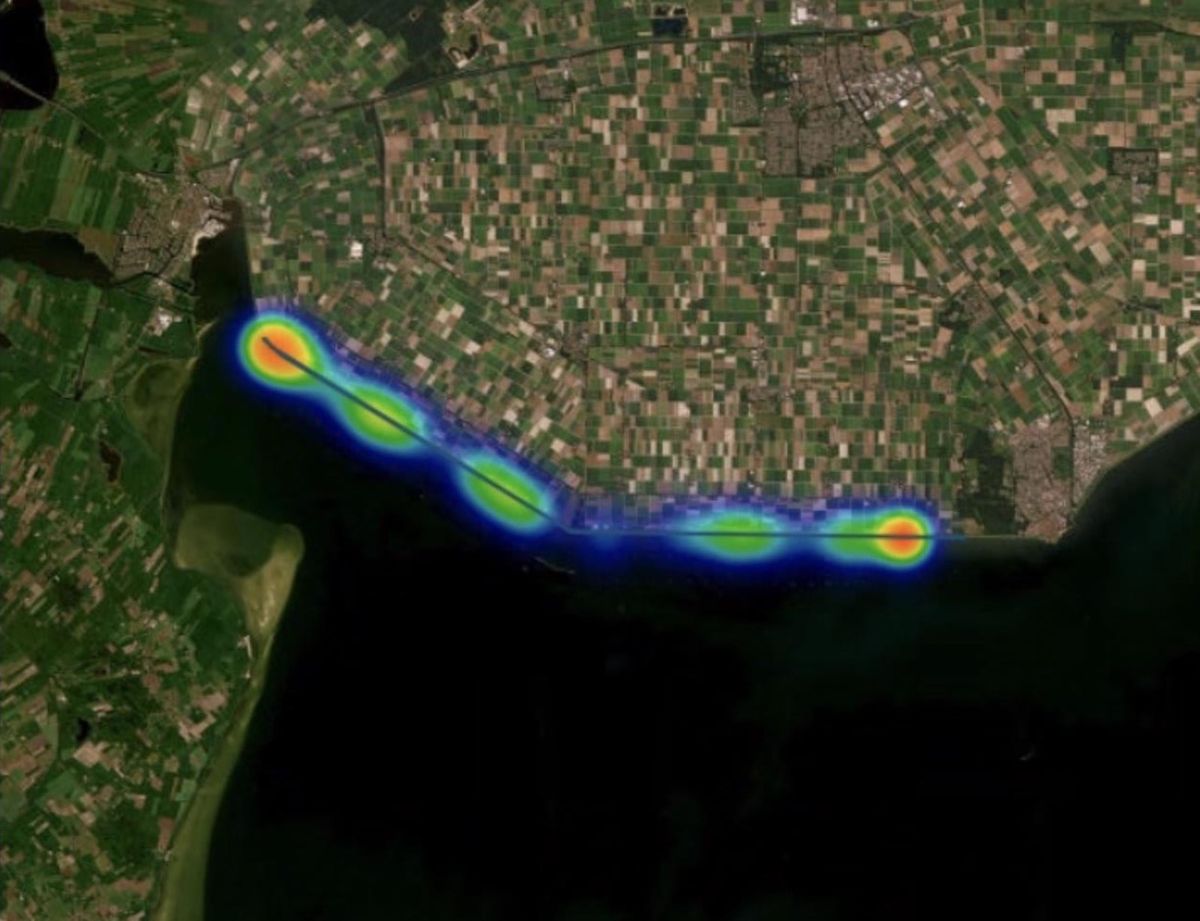
Vehicle detection
CCEM
Shows how many cars are in your city, where they drive, where they park, and whether it is getting more or less.
The challenge
Traffic and parking are still counted by hand or with fixed cameras. Both are expensive and do not scale. Counting from the air failed on the conditions of the city: tall, dense buildings that block the view to the ground, deep shadows in which a black car disappears, and so many objects so close together that a car is hard to tell from a container.
Our approach
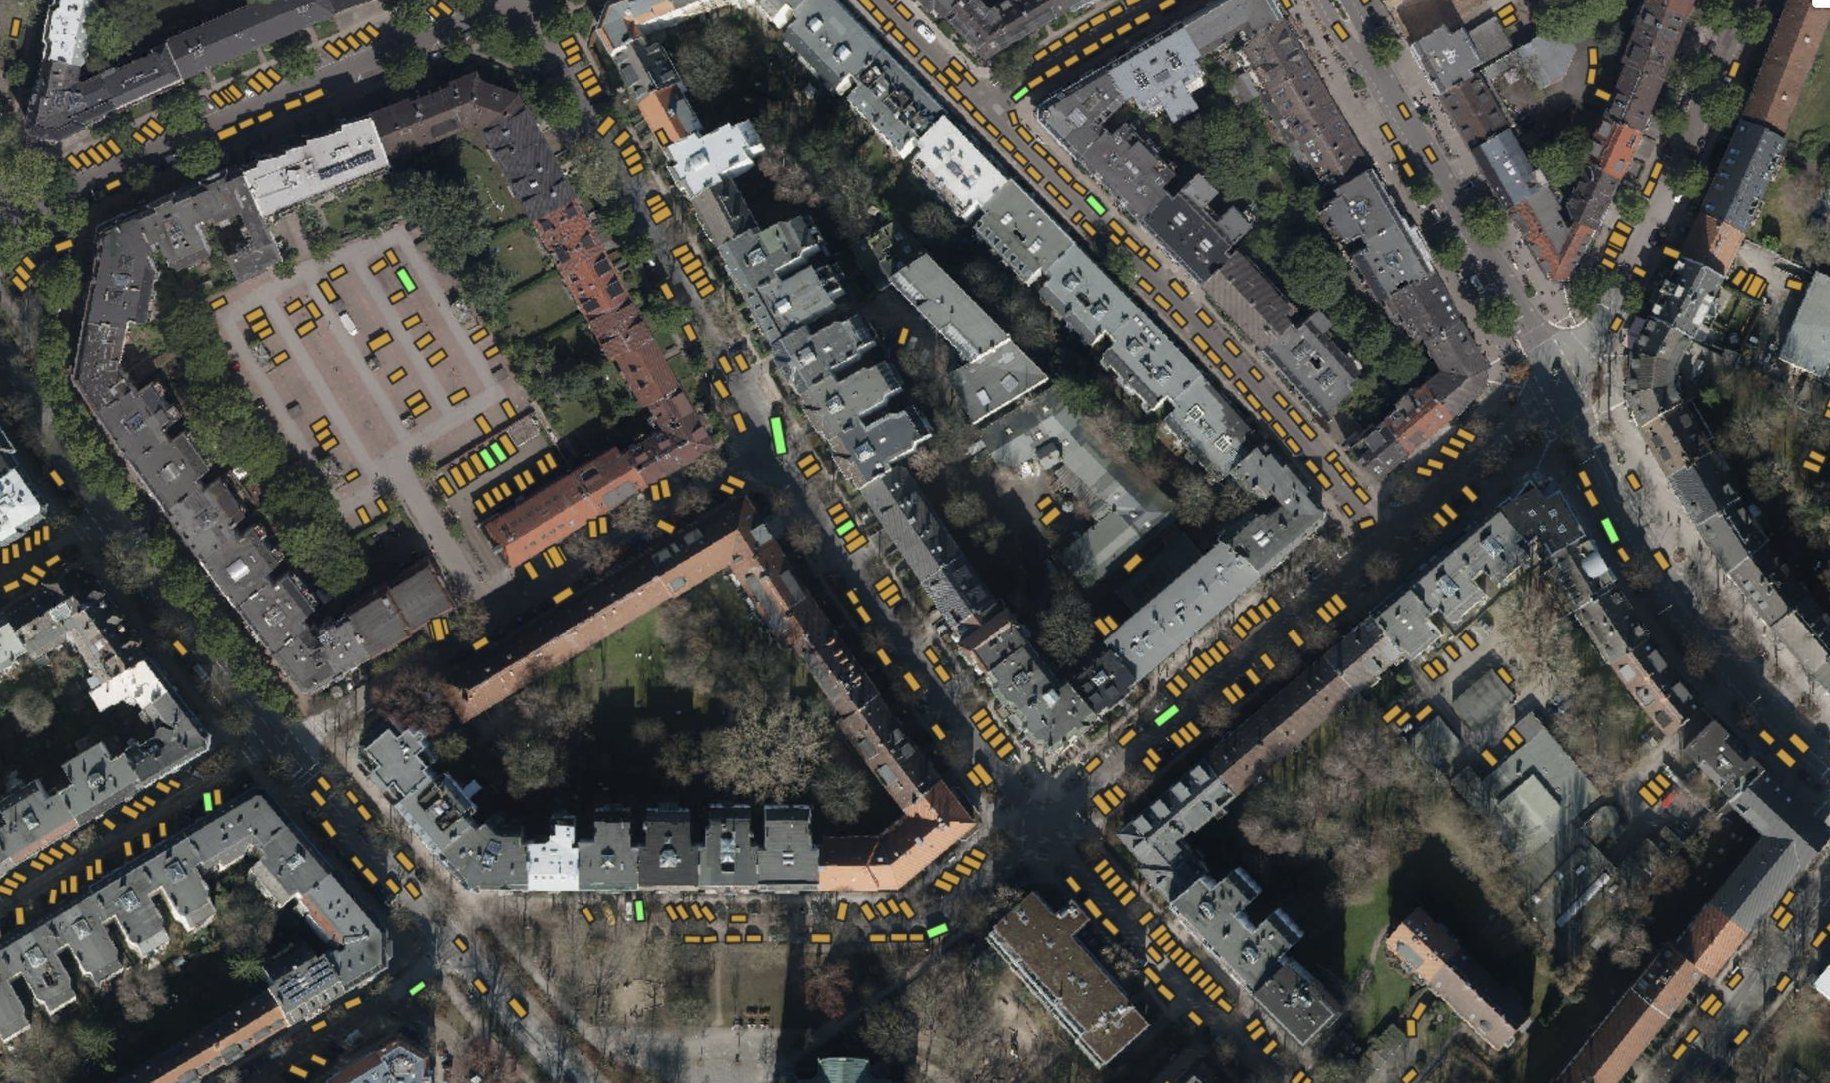
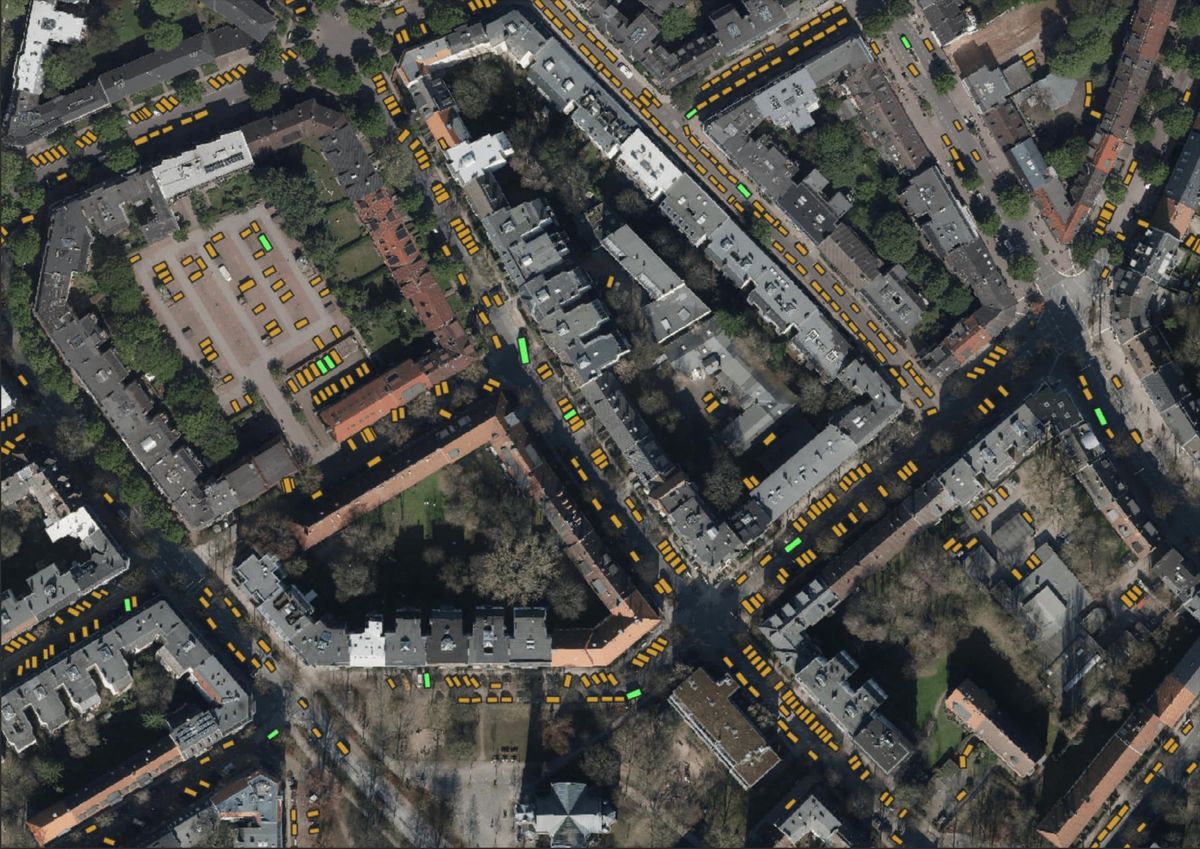
CCEM solves this for the first time. It detects vehicles from above even under urban conditions, so cities can see how traffic is distributed, derive vehicle numbers, tell cars from delivery vehicles, and even map the parking space in the city.
Four questions every city should be able to answer.
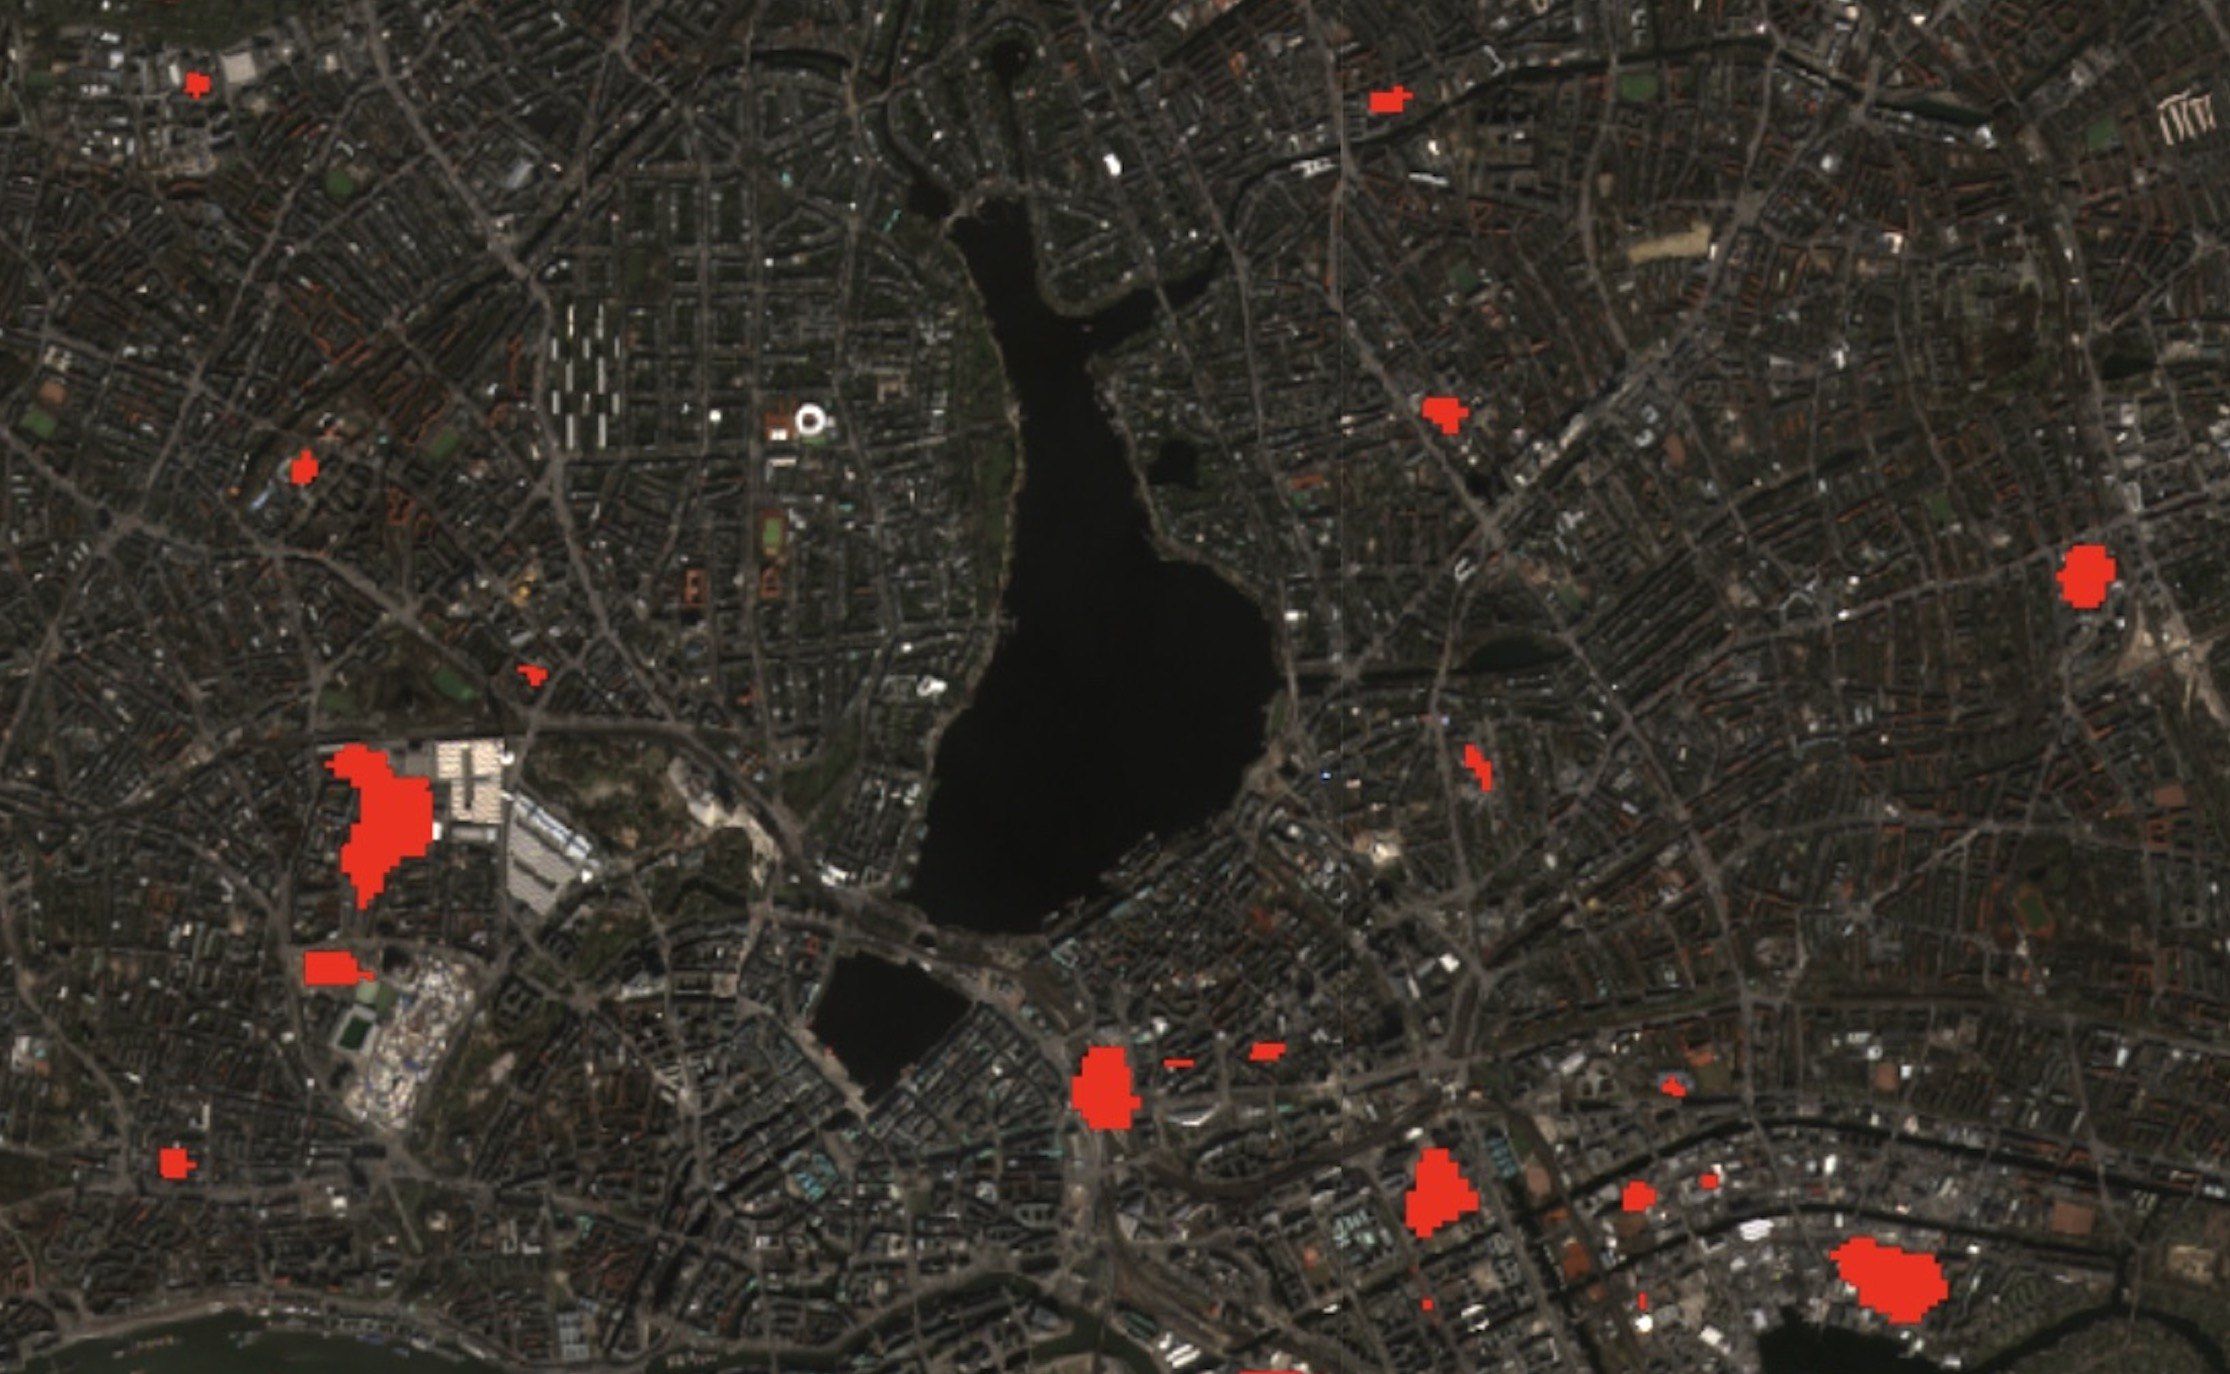
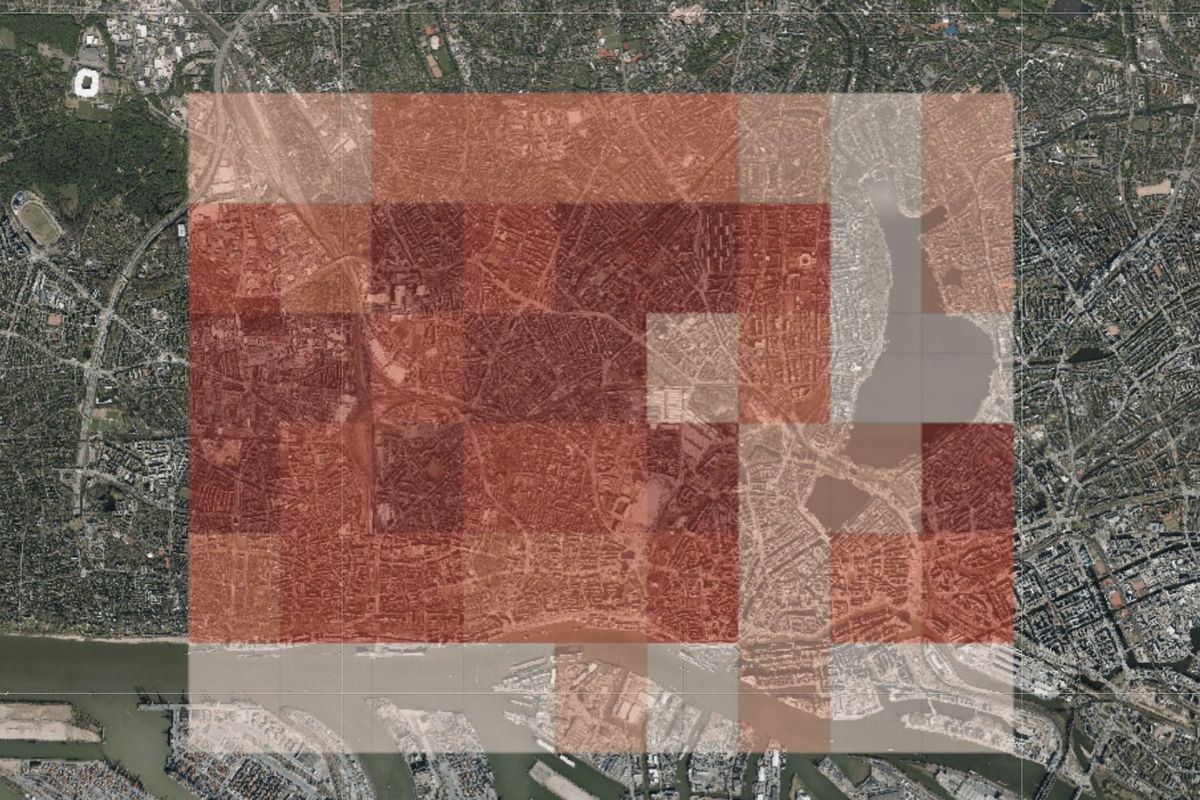
Hamburg, 2018 to 2022, from the city’s own aerial imagery.
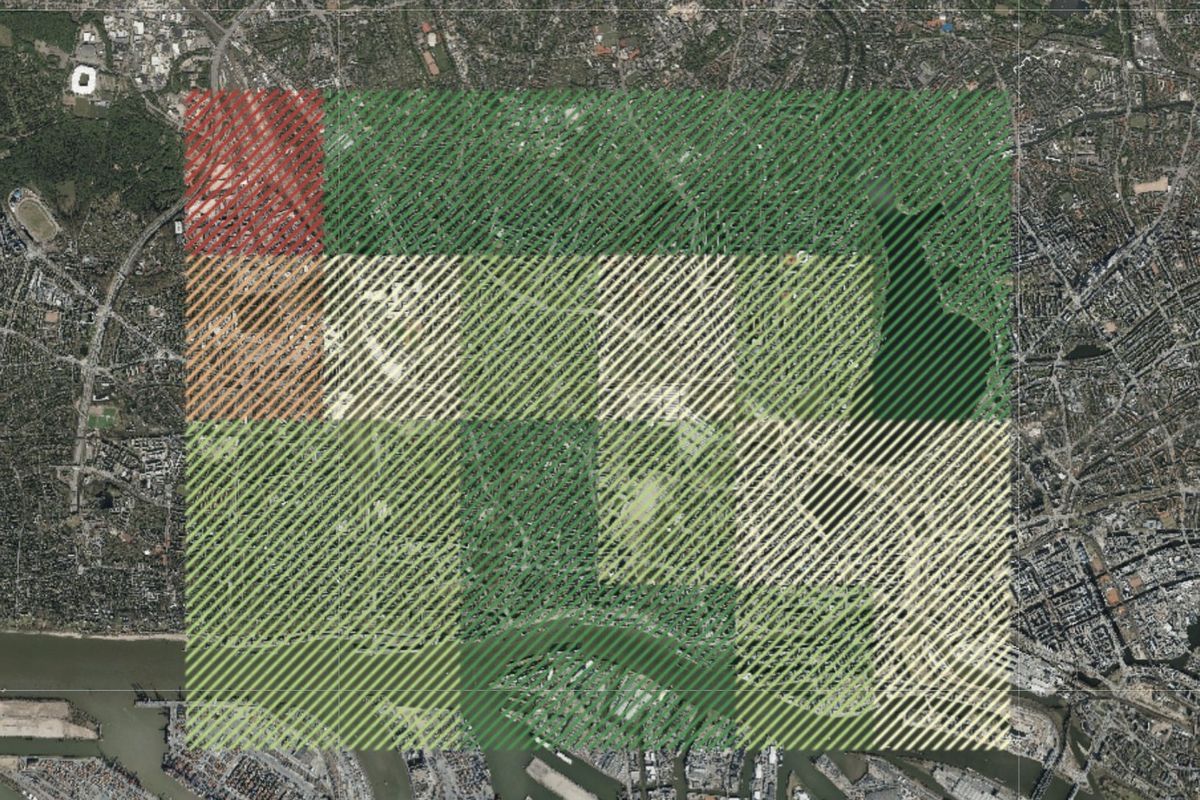
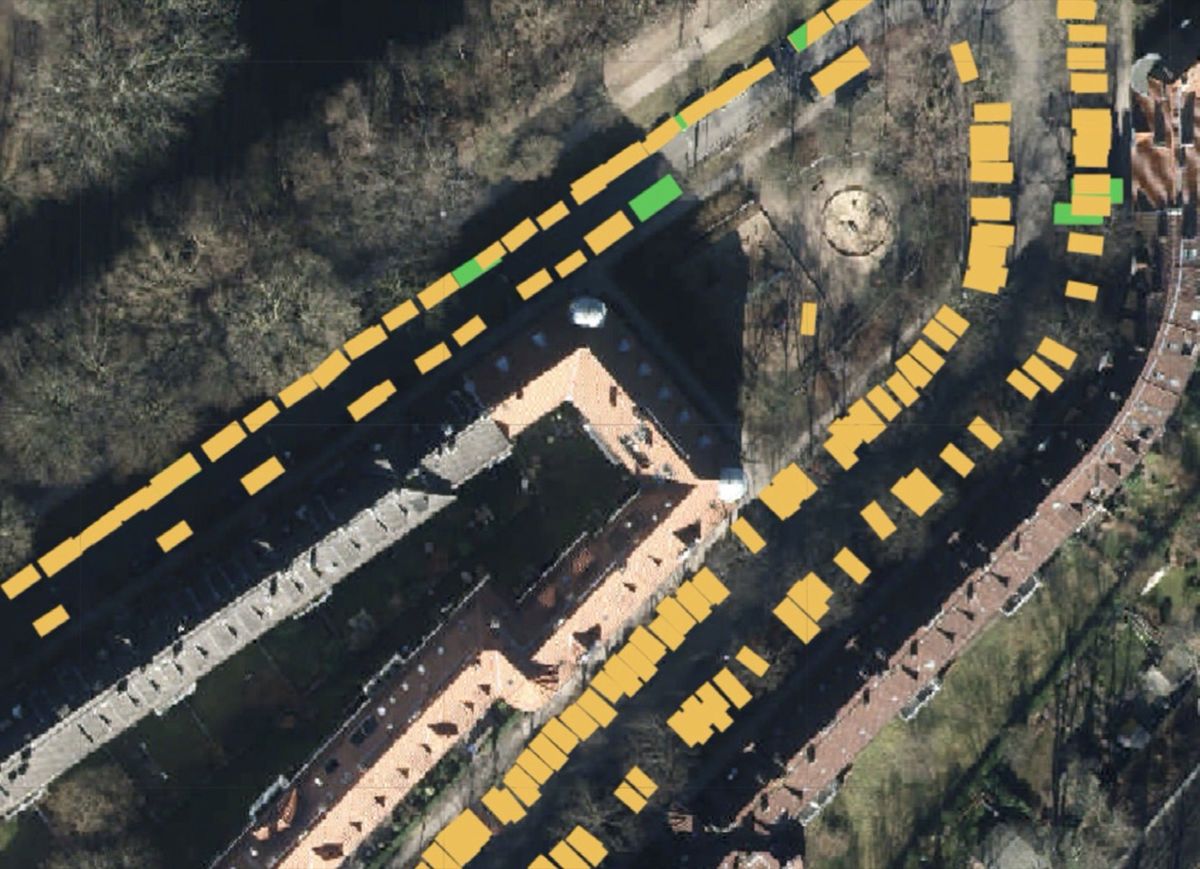
Built for the city.
Standard vehicle detection is trained on open roads and parking lots. We trained CCEM for the conditions of the city.
150,000 vehicles, annotated by hand
Instead of relying only on standard datasets of open roads, we annotated 150,000 vehicles in 40 square kilometres of Hamburg’s city centre, in shade, between trees and under canopies.
Up to 92 % detection rate
On aerial images CCEM detects up to 92 % of all vehicles, and up to 15 % more than a model trained on a standard dataset alone.
Works on archive images
Most cities fly aerial surveys every few years. CCEM reads those archives, so the trend is available from day one, without new flights or new sensors.
Where CCEM helps
- Objective vehicle counts across the whole city
- Traffic distribution by district
- Evaluating car-free zones, parking fees and other measures
- Parking space detection and parking pressure
- A fact base for planning and public communication
Who CCEM is for
- Cities and municipalities
- Urban and transport planners
- Parking and mobility operators
- Transport authorities and research institutes
Developed in 2023 with funding from the mFUND programme of the Federal Ministry for Digital and Transport. Imagery: Freie und Hansestadt Hamburg, Landesbetrieb Geoinformation und Vermessung.
Interested in CCEM?
Tell us which city you want to understand, and we’ll show you what the images say.
Daniel Lanz