Flood-protection infrastructure
DykeMap
Maps every dyke, levee and flood wall, and shows where to inspect first, before the next flood does.
The challenge
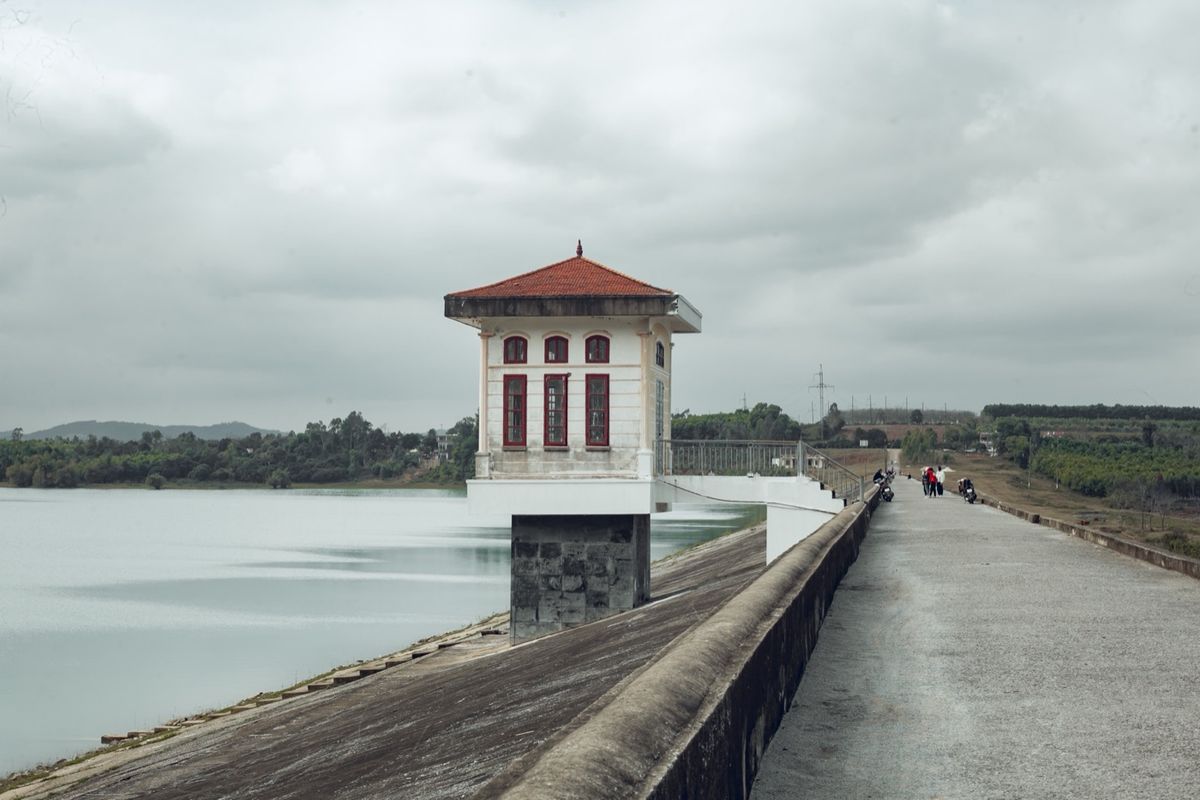
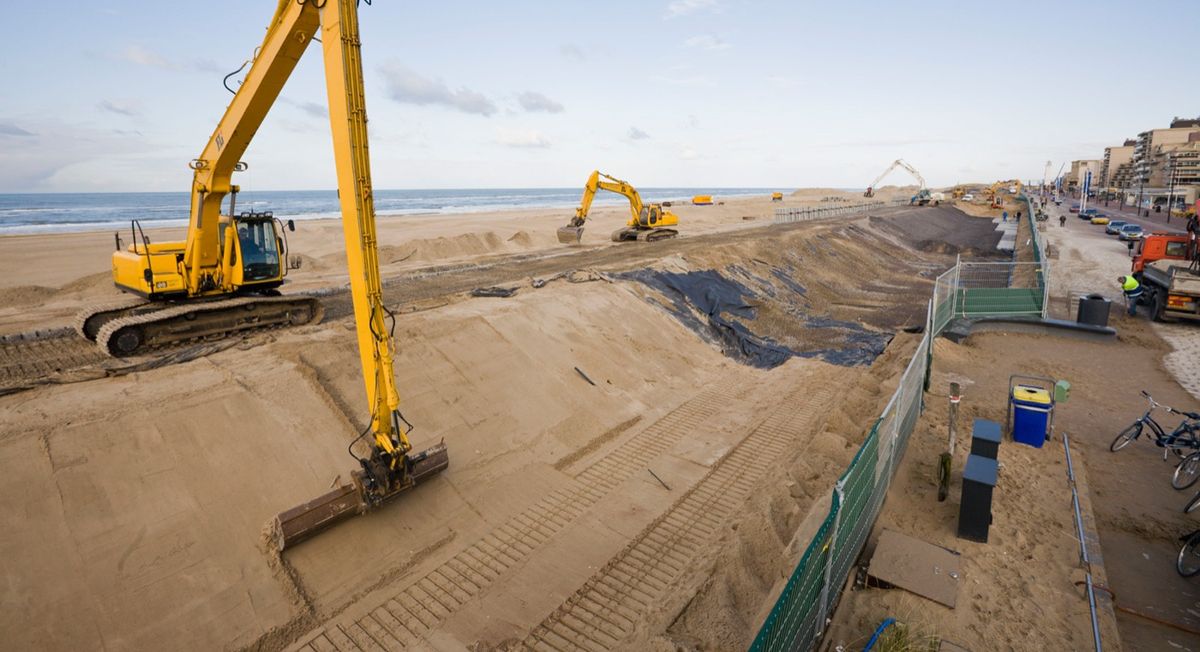
Dykes, levees and flood walls protect assets worth hundreds of billions of euros. Yet many of them grew over centuries and appear in no map at all. The rest is managed on paper: fragmented records, manual inspections and no big picture of the whole network. Rising seas and more extreme weather raise the risk every year.
Our approach
DykeMap does two things. First, it detects every dyke and flood-defence structure in a region and brings them into one single overview. Second, it monitors every section of that network from space, so that inspections on the ground go where they are needed. We don’t replace inspections. We tell you where to inspect.
Part one
Dyke detection
Every structure, in one map.
Many dykes were never registered. DykeMap finds them in the elevation data, whether they are in a register or not.
Measure the ground
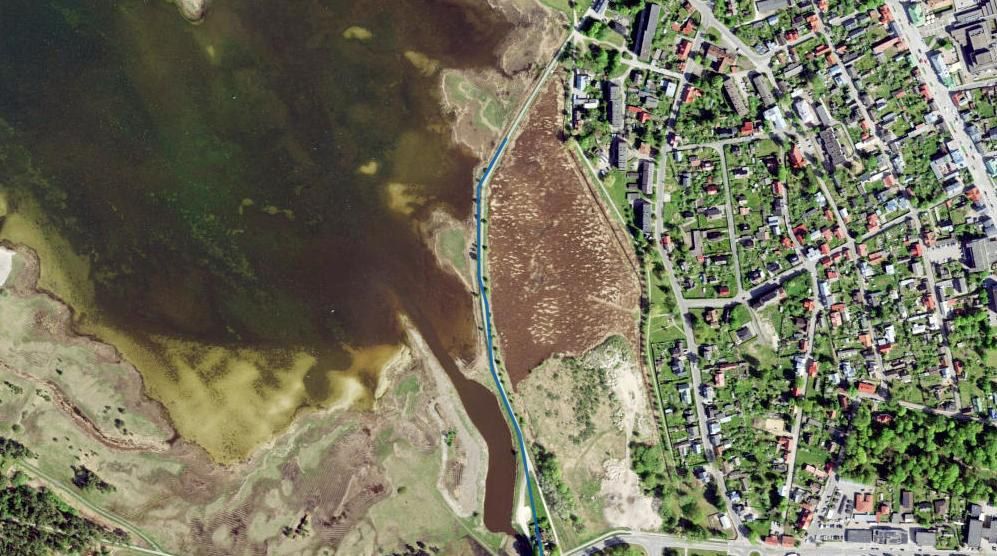
National LiDAR and Copernicus elevation models give the ground height to a few centimetres, for every metre of coast and river.
Find the walls
The algorithm looks for raised linear structures that stand above both flanks, and measures height and length along each of them.
Classify and cross-check
Each structure is classified, dyke or levee, road or rail embankment, dune belt, and compared against national registers and public map databases.
One overview
The result is one map layer in open GIS format: every structure with its type, height, length and confidence score.
Part two
Dyke monitoring
Every section, watched from space.
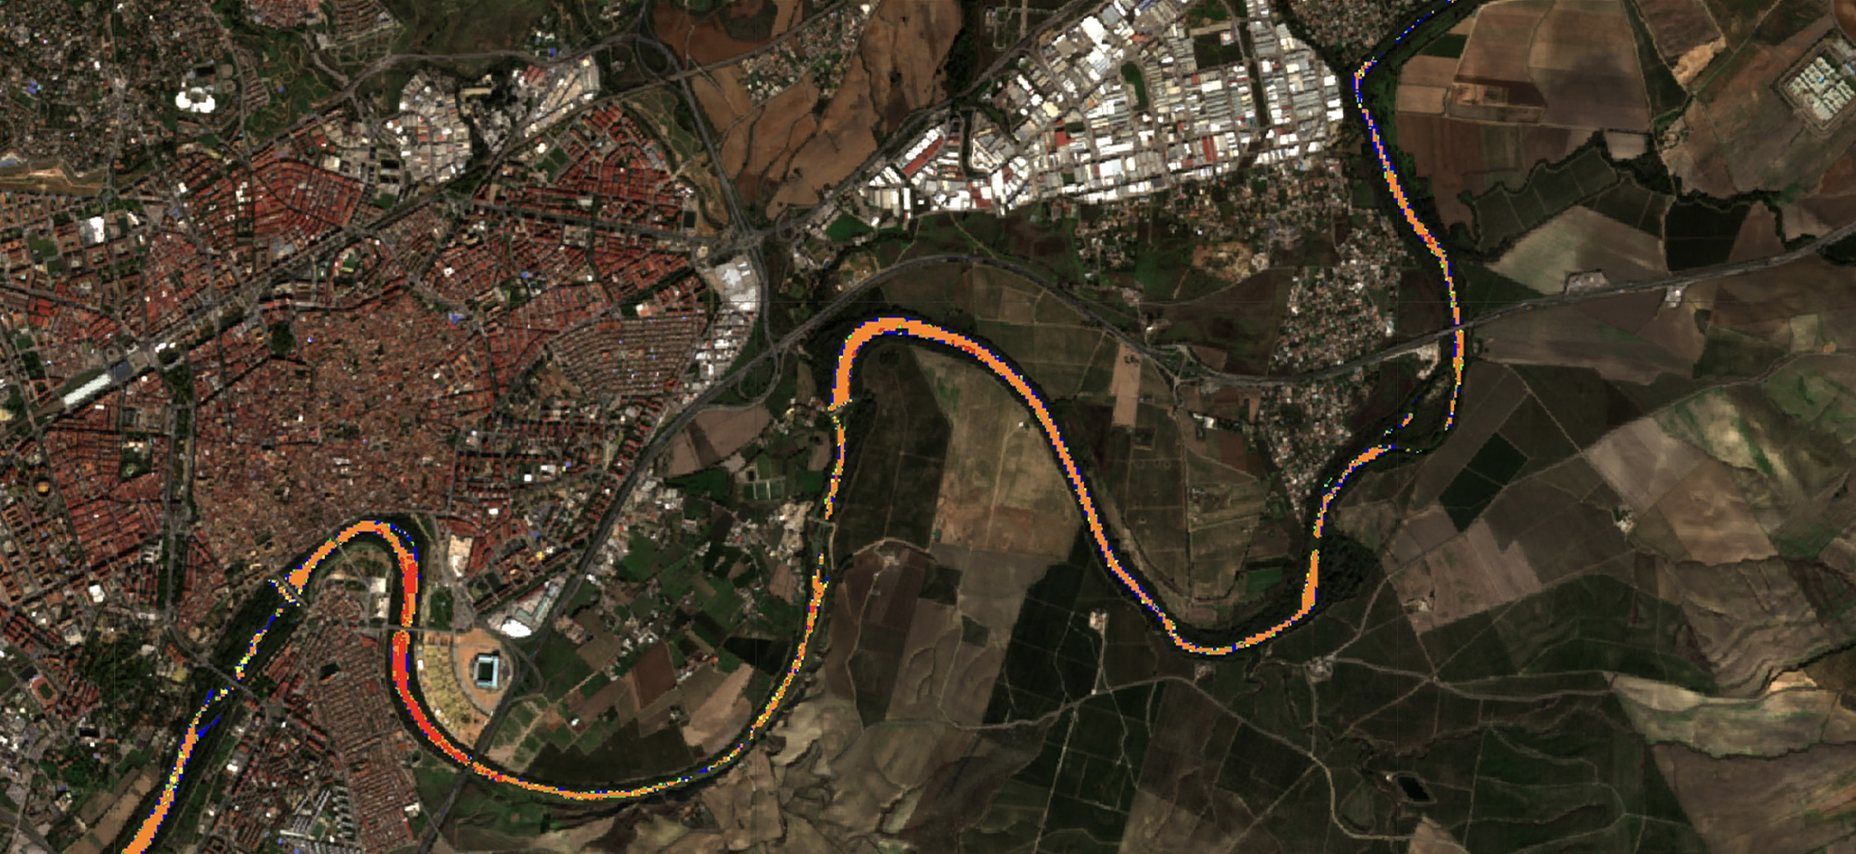
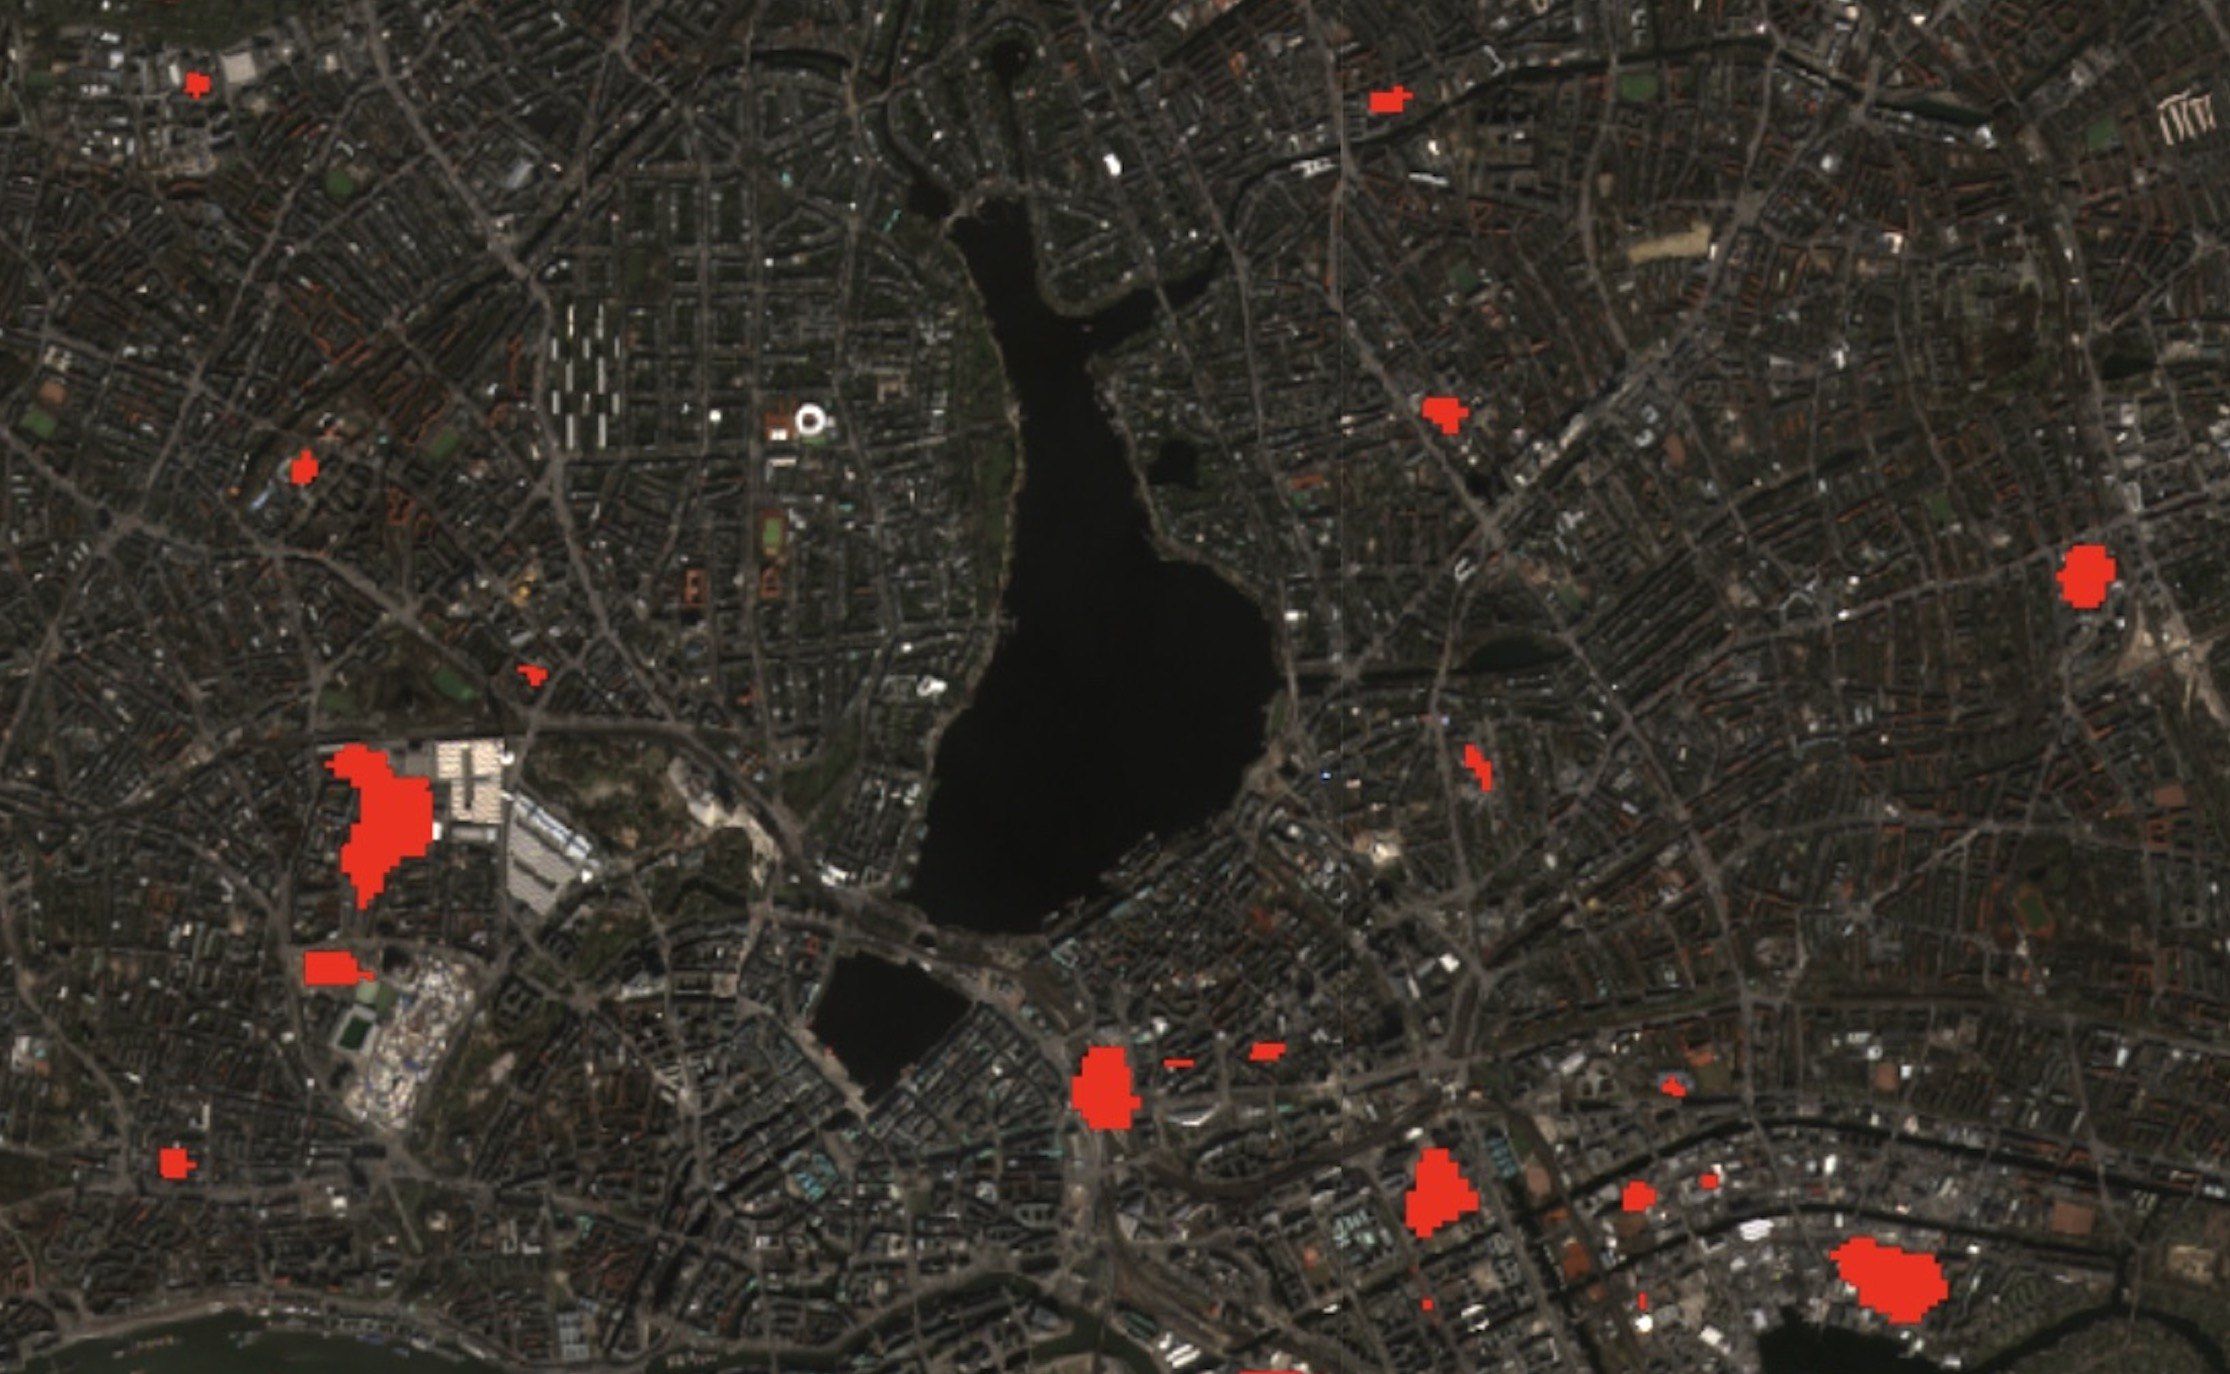
Macro monitoring as the preparation for inspections on the ground. Radar and optical satellites, fused with live gauge data, in all weather.
Ground movement
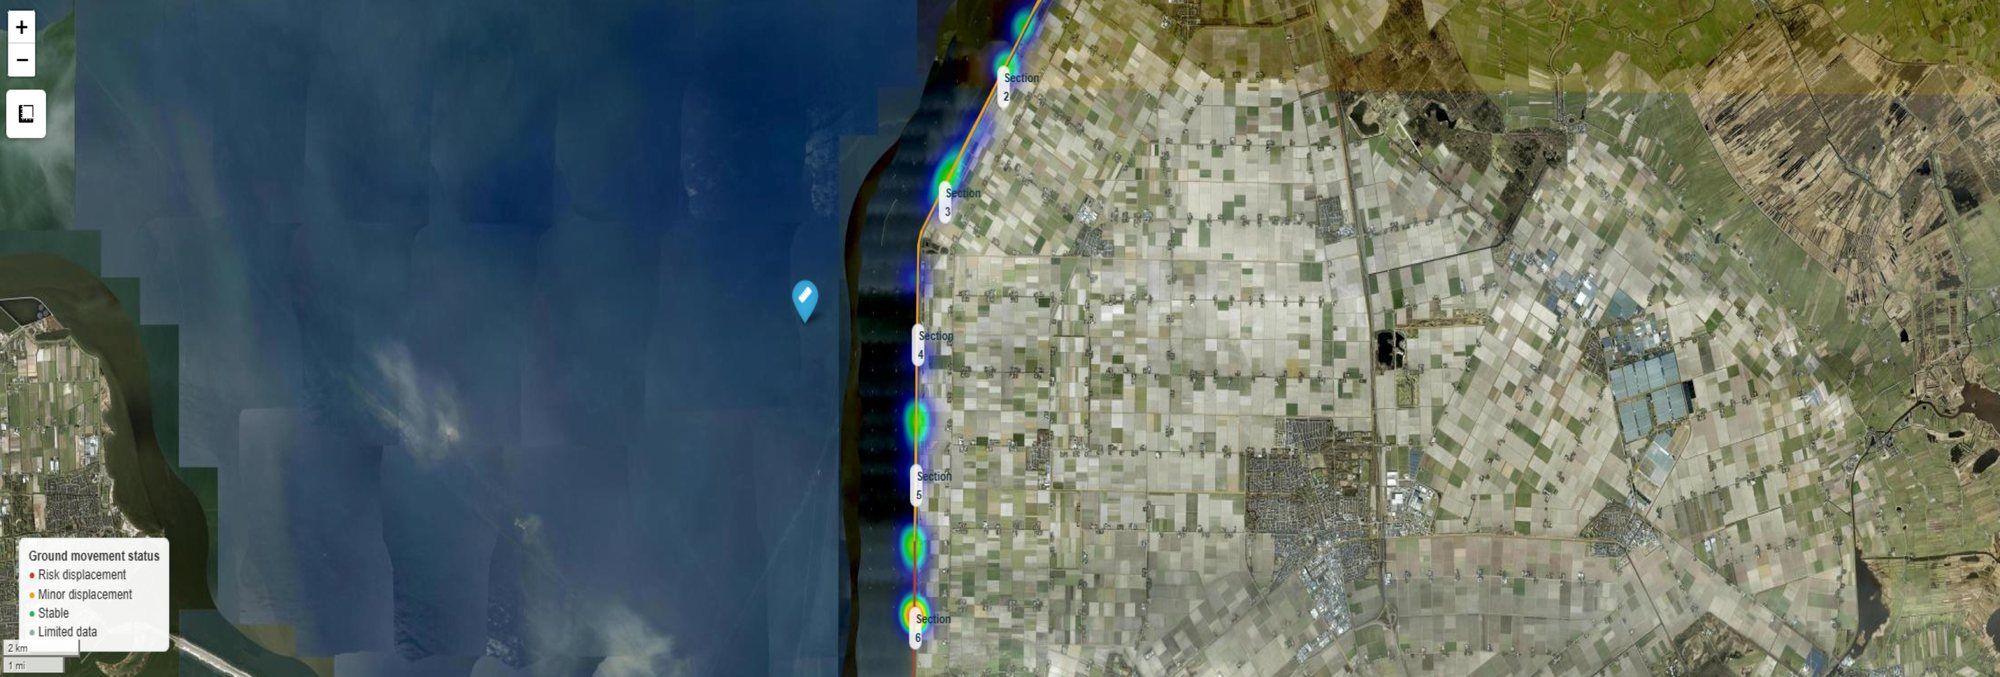
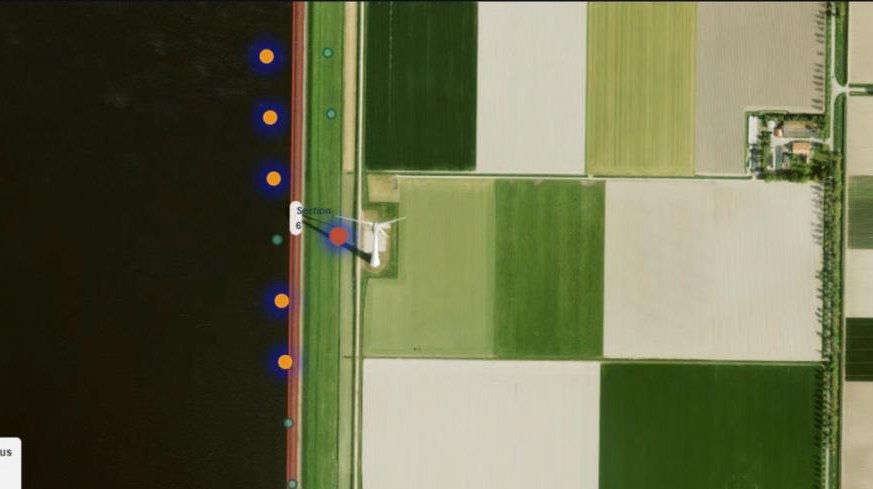
Millimetre-scale movement per section from Sentinel-1 radar, with a new pass every six days or so, through clouds and at night.
Saturation and vegetation
Sentinel-2 shows changes in moisture and plant cover every two to three days. A soaked or bare patch shows where a dyke weakens.
Water level against crest height
Hourly readings from national gauge networks, compared with the measured crest of each section: how much margin is left.
Where to inspect first
All signals come together in one status per section. The critical ones stand out, and that is where the inspection team goes.
Knowing where to look first.
One complete map of every structure, and a status for every section of it. With DykeMap, inspections go to the sections that need them, and the money goes where the risk is.
Where DykeMap helps
- A complete map of dykes, levees, embankments and dune belts
- Height, length and confidence for every structure
- Continuous monitoring of every section
- Prioritising where to inspect next
Who DykeMap is for
- Water authorities and water boards
- Infrastructure operators
- Civil protection and defence
- Insurers
In development within the ESA BIC NRW incubation programme since 2026.
Interested in DykeMap?
Tell us which flood defences you manage, and we’ll show you what the data says.
Daniel Lanz